Data Entry Best Practices and Validation Methods
Now that you understand what tidy data looks like — the structural foundation that makes every tool downstream work properly — the next challenge is getting your data into that structure in the first place. That journey begins before analysis. It begins at the moment data enters the spreadsheet.
Here's something I hear constantly from people deep in data work: a huge chunk of the time they spend "analyzing" data is actually spent fixing problems that happened during entry. Typos, inconsistent formats, mixed data types, mysterious blank cells — none of these are hard to fix one at a time, but they compound. A dataset with ten thousand rows of subtly broken data can turn a two-hour analysis into a two-day rescue mission. The good news? Almost all of this is preventable. Not by being more careful (humans aren't careful, and that's exactly the problem), but by designing the data entry experience — the column names, the validation rules, the documentation — so that errors are genuinely hard to make in the first place. That's what this section is about.
We'll start with the decisions you make before anyone types a single value: how you name columns, how you document what they mean, and how you set up rules that guide people toward consistency rather than leaving them to guess.
Column Naming Rules: The Foundation Nobody Talks About
Column names are the first design decision you make when building a spreadsheet, and they're almost always treated as an afterthought. That's a mistake. Good column names are machine-readable, human-readable, and unambiguous — all at once. Bad column names are the reason you'll be staring at a column called adj_val_2 at 11pm trying to remember what it meant when you created it six months ago.
Here are the rules, and more importantly, why each one matters:
Use descriptive names, not abbreviations. revenue_usd beats rev, r, or R_USD. The extra characters cost nothing. The clarity they buy is worth everything when you return to this file after three months away or hand it to a colleague.
Use snake_case (underscores between words), not spaces. Column names with spaces — Customer Name, Sale Date, Unit Price — cause two practical problems. First, many formulas and external tools require you to wrap spaced names in quotes or special brackets. Second, spaces make it easy to accidentally reference the wrong column when building formulas. customer_name is unambiguous. Customer Name contains a hidden space that can cause a mismatch between what you type and what Excel thinks you mean. Some teams use camelCase (customerName) instead, and that's fine — just pick one convention and stick to it.
Make every column name unique. Duplicate column headers break pivot tables, confuse XLOOKUP, and cause Power Query to silently rename one of them by appending a number. There's no valid reason to have two columns with the same name. If you have amount in two different contexts, name them amount_invoiced and amount_paid. Specificity is free.
Avoid special characters. No slashes, parentheses, ampersands, percent signs, or punctuation beyond underscores. These characters have special meaning in formulas and often break when your data is exported to another system. revenue_%_change looks meaningful but will cause headaches. revenue_pct_change is just as clear and infinitely less fragile.
Keep names lowercase. This is a convention borrowed from database practice, but it applies equally to spreadsheets. Mixed-case names introduce inconsistency the moment two people start adding columns — one person types SaleDate, another types Saledate, and now you have a filter that silently doesn't match. All lowercase removes that ambiguity.
Include units where ambiguous. If a column contains a number, and the unit isn't obvious from context, put it in the name: duration_days, revenue_usd, weight_kg. This is the single cheapest documentation you'll ever write.
A quick before-and-after comparison:
| Before (problematic) | After (clean) |
|---|---|
Sale Date |
sale_date |
Rev ($) |
revenue_usd |
# of Units |
unit_count |
adj_val_2 |
adjusted_value_v2 or — better — a data dictionary entry explaining what this actually is |
Amount (appears twice) |
amount_invoiced and amount_paid |
These conventions matter more as your spreadsheet grows, as more people use it, and as you start connecting it to external tools. A column name that seems obvious in context on the day you create it becomes a puzzle for everyone else and for future-you. Name it like you won't be there to explain it.
Data Type Discipline: One Type Per Column, Always
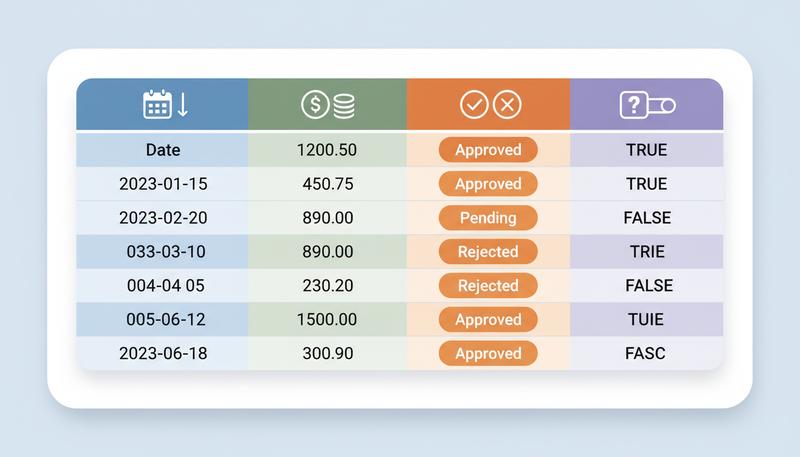
Every column in a well-designed spreadsheet contains exactly one data type. Dates. Numbers. Text. Currency. Booleans (TRUE/FALSE). Pick one. Commit to it. Never mix.
This sounds obvious until you actually encounter it. A "Revenue" column that contains $4,200, 4200, 4,200.00, n/a, TBD, and two blank cells. That column cannot be summed. It cannot be averaged. A SUMIF will silently skip the entries it doesn't recognize as numbers. A pivot table will sort them alphabetically instead of numerically because some cells are actually text. The spreadsheet will appear to work fine — it just won't give you the right answers.
Let's walk through the types you'll encounter most often:
Numbers should be stored as actual numbers, not text that looks like numbers. The difference matters more than you'd think. If you import data and numbers are left-aligned instead of right-aligned, they're stored as text and won't calculate correctly.
Currency is a subset of numbers. Store it as a plain number and apply currency formatting separately. This is a concrete application of the data-vs-presentation principle: the underlying value should be 4200, not $4,200. The dollar sign is just decoration.
Dates deserve their own section (coming up), but the short version: dates should be actual date values, not text that looks like dates.
Text categories (like "Approved", "Pending", "Rejected") need to be consistent. Exactly consistent. Approved and approved and APPROVED are three different values to your spreadsheet. The SUMIF that's counting "Approved" entries will miss the lowercase ones entirely.
Karl Broman and Kara Woo's widely cited paper on data organization puts it simply: be consistent. Their research found that inconsistency — not complexity — is the primary source of data analysis errors in spreadsheet-based work.
The Hidden Cost of Mixed Types: A Few Horror Stories
Let me make this concrete, because the abstract principle doesn't quite convey how quietly things go wrong.
The SUMIF that skips values. You have a column of sales figures. Most are numbers; a few got entered as text because someone typed a comma in the wrong place (1,200 in a text-formatted cell). You run =SUMIF(status_col,"Closed",amount_col). The function runs without error. The total is wrong by exactly the amount of those text-formatted cells, but nothing tells you this happened. You present the number with confidence. Two weeks later, someone asks why the bank statement doesn't match.
The pivot table with date chaos. Your date column has entries like 2024-01-15, Jan 15, 2024, 1/15/24, and 15-Jan. When you build a pivot table to group by month, it creates four separate groups instead of one — because it's treating those as four distinct text strings, not as the same date. You get a table with 48 rows instead of 12. Confusing to debug, embarrassing to explain to your boss.
The count that's quietly wrong. A survey response column has values 1–5, but some respondents typed "N/A" instead of leaving the cell blank. If you use COUNTA to count how many responses you have, it will include those "N/A" text strings in the count — they're non-empty cells, as far as Excel is concerned. Your denominator is inflated, your response rate is overstated, and the error is invisible because COUNTA returned a perfectly plausible number. If you'd left those cells blank instead, COUNTA would have correctly skipped them. Same issue applies when you use 0 to mean "no data" and then run an AVERAGE: AVERAGE(1, 2, 0) returns 1.0, but AVERAGE(1, 2, ) — with a blank instead of zero — returns 1.5. Zero and blank are different facts, and conflating them corrupts your arithmetic.
Warning: Excel will sometimes silently convert data types as you paste, import, or sort. A classic trap: ZIP codes that start with 0 (like 07302 for Jersey City) get converted to the number 7302 when Excel decides to be "helpful." Always check your data types after any import or paste operation.
Dates: Why ISO 8601 Matters More Than You Think
Dates are the single most common source of spreadsheet confusion, and there's one rule that fixes almost all of it: use the ISO 8601 date format: YYYY-MM-DD.
So January 15, 2024 becomes 2024-01-15.
Here's why this matters:
Sorting works correctly. YYYY-MM-DD sorts in chronological order alphabetically. 2023-12-31 sorts before 2024-01-01. Try that with 12/31/23 and 1/1/24 — the alphabetical sort puts 1/1 before 12/31 because "1" comes before "1" (really, "1/1" vs "12/", where "/" sorts before digits). Chaos ensues.
No regional ambiguity. Is 04/05/2024 April 5th or May 4th? Depends on whether you're in the US or Europe. 2024-04-05 is unambiguous to any human or system anywhere in the world.
Excel treats it as a real date. Excel stores dates as serial numbers internally (January 1, 1900 = 1, and so on). When you type in YYYY-MM-DD format, Excel recognizes it as a date value, enabling all date arithmetic: =DATEDIF(), =EDATE(), grouping in pivot tables, filtering by month.
The practical suggestion from Broman's data organization guidelines is straightforward: write dates as YYYY-MM-DD, always. If you're collecting dates from other humans, document the expected format clearly — in the column header if space allows (date_received_YYYYMMDD), and definitely in the data dictionary.
One more date trap: if you're collaborating internationally, consider storing year, month, and day in separate columns as a fallback. It's more verbose, but it's immune to any ambiguity whatsoever.
Missing Data: Empty Cell, NA, or Zero?
This is one of those decisions that seems minor until it causes a major analytical error. When data is missing, you have three basic options:
| Approach | When to Use It |
|---|---|
| Leave blank | When "no data entered yet" is meaningfully different from other states — but only if you define this clearly in the data dictionary |
| NA (or N/A) | When data genuinely doesn't exist for this observation (e.g., "number of children" for a company entity) |
| 0 | When zero is a valid, meaningful value (i.e., the measurement happened and the result was nothing) |
The danger is using these interchangeably. Zero and blank are not the same thing to Excel. AVERAGE(1, 2, 0) = 1.0. AVERAGE(1, 2, ) = 1.5 (blank is excluded). If you use 0 to mean "no data," your averages are wrong. If you use blank to mean "zero," your totals are wrong.
The University of Iowa data management guide recommends using a consistent code for missing data — like a hyphen or NA — rather than leaving cells blank, so it's clear the data is intentionally absent rather than accidentally omitted. Whatever you choose, document it in your data dictionary.
Remember: "Missing" and "zero" are different facts. A patient with zero blood pressure readings has no data. A patient with a blood pressure reading of zero has a very different problem. Don't confuse them.
Special Cases: Numbers That Aren't Numbers
Some things look like numbers but must be stored as text. ZIP codes. Phone numbers. Account IDs. Social Security numbers. Product codes that start with zeros.
If you store ZIP code 07302 as a number, you get 7302. The leading zero disappears forever. Mail to Jersey City never arrives. (Metaphorically. But also sometimes literally, if someone exports that data to a mailing list.)
The fix is simple: force these columns to text format before entering data. In Excel, format the column as Text first, then type the values. If you're importing from a CSV, specify the column type as text during import.
A column naming convention can help signal this to anyone working with your data: zip_code_text, phone_raw, account_id. The suffix serves as a reminder that this value must not be treated as a number.
flowchart TD
    A[Does this column contain numeric values?] --> B{Will you ever do math on it?}
    B -->|Yes — sum, average, multiply| C[Store as Number]
    B -->|No — just identify or categorize| D{Does it have leading zeros or special formatting?}
    D -->|Yes| E[Store as Text]
    D -->|No| F{Will you use it in date calculations?}
    F -->|Yes| G[Store as Date]
    F -->|No| H[Store as Text or Number based on usage]
    C --> I[Apply number/currency formatting for display]
    E --> J[Format column as Text before entering data]
Data Validation: Making Errors Hard to Make
Here's the principle: don't rely on people to be consistent. They won't be. Not because they're careless, but because humans are creative — they find seventeen ways to spell "California" ("CA", "Ca.", "Cali", "california", "California", "CALIFORNIA"...). The solution is to constrain what they can enter in the first place.
Both Excel and Google Sheets provide data validation — rules that restrict what can go in a cell or column. It's one of the most underused features in spreadsheets, which is a shame because it prevents so many problems.
Dropdown lists. The most useful type. You define a list of acceptable values, and the cell shows a dropdown menu. Users pick from the list rather than typing freehand. Status fields, category fields, region fields — anything with a fixed set of options should use a dropdown. No exceptions.
In Excel: select the column → Data tab → Data Validation → Allow: List → specify your source values. In Google Sheets: Data → Data validation → Criteria: List of items.
Numeric ranges. Constrain a number column to only accept values within a reasonable range. If you're collecting survey responses on a 1-5 scale, reject anything outside that range. If you're entering ages, reject values below 0 or above 130.
Date constraints. Restrict a date column to accept only dates after a certain point ("no orders before 2020-01-01") or within a specific range. This catches the classic error where someone types a year wrong — entering 2014 instead of 2024 — which would otherwise silently corrupt your time series analysis.
Custom formulas. For advanced cases, you can write a formula to validate input. =LEN(A2)=5 ensures ZIP codes are exactly 5 characters. =ISNUMBER(A2*1) ensures a text-formatted column actually contains numeric characters.
Two important details about what validation won't protect you from:
First, data validation in Excel doesn't retroactively flag values that were already in the column before you set up the rule. It only prevents new entries from violating the rule. If you're adding validation to an existing dataset, use Conditional Formatting to highlight existing violations separately.
Second — and this one catches experienced users too — copy-pasting data over a validated cell bypasses the validation check, allowing invalid data to be entered. Unlike typing directly into a cell, which triggers validation, copy-pasting does not execute the validation check. The validation rule typically remains on the cell, but is not enforced during paste operations. In Excel 365, the rule stays intact but validation is bypassed; in earlier versions, behavior varied and the validation rule could sometimes be removed. with whatever was in the source. The rule is gone, no error is thrown, and future entries are now unconstrained. The only defenses are: periodically audit your validation rules to make sure they're still in place, and train anyone entering data to use Paste Special → Values Only when pasting into a validated range.
Tip: In Excel, you can add an input message to a validated cell — a tooltip that explains what the user should enter. This turns validation from a locked door into a helpful guide. Data → Data Validation → Input Message tab. Takes 30 seconds to set up and saves a lot of confused emails.
The Data Dictionary: Your Spreadsheet's User Manual
A data dictionary is a separate document (or a separate tab in your workbook) that explains what every column means, what values it accepts, what format it uses, and who's responsible for it. It's the metadata about your data.
This sounds bureaucratic until you've spent two hours staring at a column called adj_val_2 trying to figure out whether the 2 refers to a version number, a secondary adjustment, or something from a project that predates everyone currently on the team.
A minimal data dictionary entry for a column includes:
| Field | Description |
|---|---|
| Column name | Exactly as it appears in the spreadsheet |
| Description | What this column represents in plain English |
| Data type | Number, Text, Date, Boolean, Currency |
| Allowed values | For text: the valid options. For numbers: the valid range. For dates: the format |
| Required? | Can this cell be blank, or is a value mandatory? |
| Notes | Any quirks, history, or edge cases |
Here's what three rows of a data dictionary might actually look like:
| Column Name | Description | Data Type | Allowed Values | Required? | Notes |
|---|---|---|---|---|---|
customer_id |
Unique identifier for each customer account | Text | 8-character alphanumeric (e.g., CU001234) | Yes | Must not be reformatted as number — leading zeros matter |
signup_date |
Date the customer created their account | Date | YYYY-MM-DD | Yes | Leave blank if account was migrated; see is_migrated column |
plan_type |
Subscription plan at time of signup | Text | Basic / Pro / Enterprise | Yes | Legacy plans (Starter, Plus) still appear in data before 2022 |
The data dictionary isn't glamorous work. But Broman's data organization recommendations list it as one of the twelve core principles of well-organized spreadsheet data — alongside the basics like "be consistent" and "make it a rectangle" — because it's what makes a spreadsheet usable by more than one person, including future-you.
Teams that maintain data dictionaries make fewer data entry errors (the dictionary sets expectations clearly), resolve disagreements faster ("what does 'active' mean for a customer?" — check the dictionary), and onboard new team members in a fraction of the time. That alone is worth doing.
Designing for the Human Entering Data
Here's a mindset shift that changes how you design data entry experiences: stop thinking about what the analyst needs to see, and start thinking about what the data entry person needs to do.
Most spreadsheet designers are analysts. They design data entry experiences optimized for analysis — which means they create complexity that confuses data entry staff, who then make errors, which defeats the entire purpose.
A few principles for designing data entry that actually works:
Keep one job per tab. Don't ask someone to enter customer information, order details, and shipping status in the same table. Split these into separate, focused entry areas. A person knows what they're doing and can move faster.
Use dropdowns aggressively. Every field that has a fixed set of options should be a dropdown. Don't make humans type "Midwest Region" fourteen times a day. They will spell it differently every other time.
Add input instructions directly in the sheet. A row above the data area with brief format instructions ("YYYY-MM-DD", "numbers only, no $ sign", "select from list") takes five minutes to add and prevents dozens of errors down the line.
Freeze header rows. If your data entry sheet is tall, freeze the header row so column names are always visible. Sounds obvious. Is frequently absent anyway.
Separate raw entry from analysis. Consider having a data entry tab that's clean and simple, with a separate analysis tab that pulls from it. Data entry staff see a form. Analysts see a dataset. Everyone gets what they need.
The goal is to make the correct entry the easy entry. Every time you leave a field open to freehand text when a dropdown would work, you're betting on human consistency — and that's a bet you'll lose every single time.
All of these practices — naming conventions, data types, date formats, missing data handling, validation, the data dictionary — are expressions of the same underlying principle: the structure of your data is a design decision, not an accident. When you treat data entry as a design problem rather than a clerical task, you end up with datasets that actually answer questions rather than datasets that generate new questions about the data itself.
The next section gets into what happens when data arrives already broken — how to identify it, clean it, and transform it into something usable. But the best data cleaning is the cleaning you never have to do, because the data was right from the start.
Only visible to you
Sign in to take notes.