How to Learn Spreadsheets More Effectively
Picture this: you open a spreadsheet someone else built — or one you built yourself six months ago — and it takes you twenty minutes just to understand what you're looking at. There are merged cells spanning five columns. Rows are color-coded, but nobody wrote down what the colors mean. Totals are scattered throughout the data, not at the bottom. Key numbers are hardcoded directly into formulas, invisible unless you click into each cell. Someone has added a note in the corner that says "DO NOT SORT." The spreadsheet technically contains the information you need. Getting it out will require an afternoon.
This is the spreadsheet as trap. And the uncomfortable truth is that the person who built it almost certainly thought they were doing it right.
The harder question isn't what went wrong — it's why this happens in the first place. Why do so many of us instinctively build spreadsheets the wrong way, and why does the software itself seem to encourage that instinct?
The answer lies in how we learn. Most spreadsheet training — whether it's a formal course, a YouTube tutorial, or someone showing you how to do something "the way we do it here" — focuses almost entirely on features. Learn VLOOKUP. Learn how to write an IF statement. Master the pivot table. These are all useful skills, but they're taught in isolation, disconnected from any larger principle that ties them together. You learn that formulas exist, but not why certain formulas fail in certain data structures. You learn that pivot tables are powerful, but not why they only work when your data is organized a specific way. The features start to feel like disconnected tricks rather than tools that serve a bigger purpose.
As a result, most people develop a mental model of spreadsheets that's fundamentally misaligned with what actually works: they think of a spreadsheet as a formatted document — something designed to be read and understood when someone opens it. This is a perfectly reasonable instinct. Spreadsheet software looks like a page layout tool. It has fonts, colors, borders. But that mental model is dangerous because it leads directly to the anti-patterns we'll examine in Section 2: merged cells, hardcoded values, color-coding that means something nobody can remember. These things look great on the screen, but they break the data system underneath.
This section is about understanding how that mental model took root — and why it's so hard to shake.
When people sit down to build a spreadsheet, they often start with the final report in their head. They create visual headers that span multiple columns. They put summary totals at the top where they're easy to see. They color-code rows by category instead of adding a "Category" column. They embed assumptions directly into formulas instead of in labeled cells. The spreadsheet looks great. It's also nearly impossible to analyze.
Karl Broman's research on data organization in spreadsheets captures this tension perfectly: "data in spreadsheets can be pretty and easy to work with, or they can be a sloppy mess requiring serious downstream reorganization efforts." Notice that word choice — "pretty" and "easy to work with" are presented as competing goals. That tension is real, and it's the core problem we're going to solve in this course.
Remember: The habits that make a spreadsheet look professional at a glance — merged cells, color-coded rows, visual groupings — are often the exact same habits that make it analytically useless. These aren't just stylistic choices; they're structural decisions.
How Spreadsheet Education Gets It Backwards
The typical spreadsheet course starts with the interface, works through basic formulas, and then introduces "advanced" features one at a time: pivot tables, VLOOKUP, maybe some conditional formatting. The implicit promise is that fluency with enough features adds up to spreadsheet mastery.
It doesn't work that way, and here's the core reason: features are only as powerful as the structure underneath them. A pivot table can do extraordinary things, but only if your data is structured in a way the pivot table understands. VLOOKUP can find anything — until the data it's searching isn't organized consistently. Conditional formatting is genuinely useful — until you're applying it to a spreadsheet where the same information appears in five different formats depending on who entered it.
Learning features without understanding structure is like learning power tools before you understand carpentry. You can make cuts, but you can't build furniture.
The deeper problem is how most people actually acquire spreadsheet skills. Rather than learning systematically, they do it reactively. They encounter a problem at work, someone shows them a formula that solves it, they use that formula again whenever they see a similar situation. Over time they build up a toolkit of tricks without ever developing the underlying architecture knowledge that would let them design solutions from the ground up.
[The UK Department for Education's spreadsheet standards guide](https://dfe-analytical-services.github.io/spreadsheet-standards/good-practice-for-excel-based-modelling.html) makes an observation that sounds simple but is surprisingly profound: "Excessive inter-linking can be an indication of poor logic in the design of the model." Complexity in a spreadsheet is often a symptom, not a feature. When things get tangled, it usually means the underlying structure was designed incorrectly — and you can't untangle the mess without first understanding what good structure looks like.
The Printed Report vs. the Database
Here's the foundational analogy for this entire course. Hold it in your head; we'll return to it many times.
Imagine a printed quarterly sales report. It has a title at the top, section headers for each region, bold totals rows, a footer with the date. It's designed to be read by a human, linearly, from top to bottom. It's beautiful and communicative — for that specific purpose.
Now imagine a database table of sales transactions. Every row is one transaction. Every column is one attribute: date, rep name, region, product, amount. No fancy formatting. No merged cells. No color-coding. It's not designed to be read directly by humans — it's designed to be queried. You can ask it anything: total sales by region, average deal size by rep, month-over-month comparison for any product. The answers are all there, waiting.
The printed report is optimized for a specific audience looking at a specific moment in time. The database is optimized for flexibility — it can answer questions that haven't even been asked yet.
Here's what happens in most organizations: people build printed reports in their spreadsheets. The goal of this course is to teach you to think in databases — even when you're using Excel.
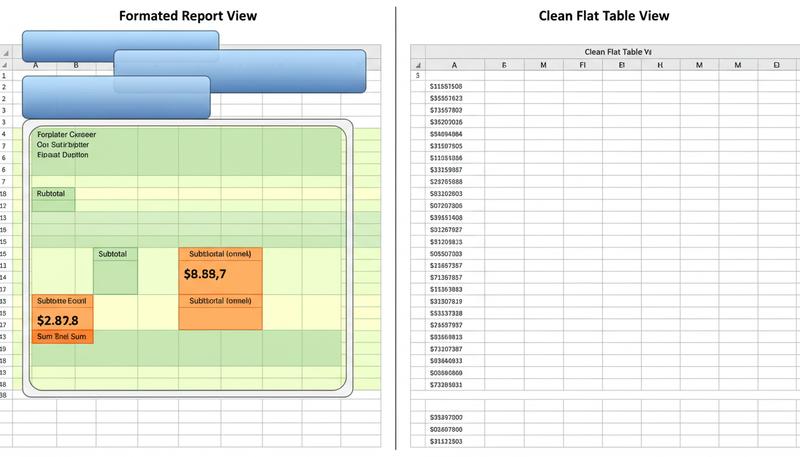
This doesn't mean your final output can't look like a report. It absolutely should. But the report should be generated from clean data, not built by hand in a messy spreadsheet. That distinction — between the data layer and the presentation layer — is the core mental model we're going to develop throughout this course.
The Data-vs-Presentation Mental Model
The single most important concept in this entire course fits in one sentence:
Your data and your presentation of that data should live in different places.
Data is raw, consistent, machine-readable. Presentation is formatted, designed, human-readable. When you mix them — when you use cell color to encode a category, or merge cells to create a visual header, or hardcode a total because it looks cleaner than a formula — you've collapsed two separate concerns into one space, and you've damaged both in the process.
graph TD
    A[Raw Data Layer\nClean, consistent, queryable] --> B[Analysis Layer\nFormulas, lookups, aggregations]
    B --> C[Presentation Layer\nFormatting, charts, dashboards]
    style A fill:#e8f5e9
    style B fill:#fff3e0
    style C fill:#e3f2fd
Think about how a professional publication works. The writers write. The editors edit. The designers design. The copy doesn't get formatted while it's being written, and the layout doesn't happen while the copy is being drafted. Separation of concerns produces better work in each layer.
Spreadsheets work the same way. When you separate data from presentation:
- Your data becomes reusable across multiple views and reports
- Your formulas become simpler because they're not working around weird formatting decisions
- Your analysis becomes more powerful because the data is structured consistently
- When requirements change (and they always change), you can update one layer without breaking the others
This mental model will show up in every section of this course. When we talk about tidy data structure in Section 3, we're talking about what good data looks like. When we build pivot tables in Section 9, we're talking about one way to create the analysis layer on top of that data. When we build dashboards in Section 13, we're talking about the presentation layer. Each layer has its own rules, its own best practices — and they shouldn't be mixed.
Tip: The next time you catch yourself merging cells, adding decorative color, or hardcoding a value that "everyone will know," ask: am I making a data decision or a presentation decision? Often just asking the question is enough to point you toward the right structure.
What 'Thinking in Spreadsheets' Actually Means
People who are genuinely good at spreadsheets — not just formula-fluent, but structurally sound — have developed a habit of thought that's difficult to articulate if you've never seen it modeled. They think in data shapes.
When they're handed a new problem, before they even open Excel, they're already asking: What is the fundamental unit of information here? Is it a transaction? A person? A product? A time period? What attributes does each unit have? How might I want to slice this data later? What questions will I need to answer?
This is design thinking applied to data. It's the same kind of thinking a software engineer does when designing a database schema, or that a researcher does when designing a data collection instrument. It's systematic, and it's learnable — which is why we're spending so much time on it here before we touch a single formula.
Broman's observation about data analysts is worth sitting with: the question isn't whether you can reorganize data, it's whether you should have to. "How would you like your data analysts to spend their time? Reorganizing data, or really analyzing data?" When you think structurally from the start, you eliminate hours of downstream cleanup — not just for yourself, but for anyone who ever works with your spreadsheet.
The learnable skill isn't memorizing rules. It's developing an instinct for structure that becomes automatic: recognizing when something looks like data that should be a column rather than a formatting choice, noticing when a merged cell is obscuring an analytical opportunity, seeing the underlying rectangle of information hiding inside a prettily formatted table.
That instinct is what this course is designed to build.
How This Course Is Structured
We're going to move through four conceptual phases:
Phase 1: Diagnosis and Foundation (Sections 1–3) — Where we are now. We're establishing the vocabulary, the mental models, and the ability to recognize what good structure looks like versus what bad structure looks like. By the end of this phase, you'll be able to audit someone else's spreadsheet and identify exactly what's broken and why.
Phase 2: Building Clean Data (Sections 4–5) — Once you know what good data looks like, we get into the practical mechanics of creating and cleaning it. Data validation, consistent naming, data dictionaries, transformation techniques. This is the "boring part that matters" phase — and I mean that with genuine affection, because getting this right makes everything else dramatically easier.
Phase 3: Analysis Power Tools (Sections 6–10) — With clean data underneath you, this is where spreadsheets become genuinely thrilling. Excel Tables, lookup functions, conditional aggregation, pivot tables, and the modern dynamic array functions that have fundamentally changed what's possible. Each of these tools is dramatically more powerful when your data is properly structured — and you'll see that payoff clearly because you'll have built the foundation.
Phase 4: Presentation and Decision-Making (Sections 11–13) — The presentation layer, done right. Conditional formatting, charts, dashboards, and scenario modeling. This is where data becomes decisions.
Each section builds on the previous ones, but I've also tried to make each section independently useful. If you're an experienced Excel user who's reasonably confident about structure but shaky on dynamic arrays, you can jump to Section 10. If you're inheriting a disaster spreadsheet and need to fix it now, Sections 2 and 5 will be your fastest path.
Warning: If you're tempted to skip ahead to the "interesting" formula sections, consider that the diagnosis sections (especially Section 2 on anti-patterns) will fundamentally change how you see every spreadsheet you encounter. The best practitioners I know can identify a structurally broken spreadsheet within thirty seconds. That skill is teachable, and it's there if you're willing to invest in it.
One more thing before we dive in: this course is deliberately not a comprehensive Excel reference. There are excellent books and documentation for that purpose. This course is about how to think — which is the part those references almost never address. By the end, you'll have the mental frameworks to learn any new feature quickly, because you'll understand where it fits in the overall system.
Let's start by looking at what broken spreadsheets actually look like — so we can learn to build the opposite.
Only visible to you
Sign in to take notes.